10N2
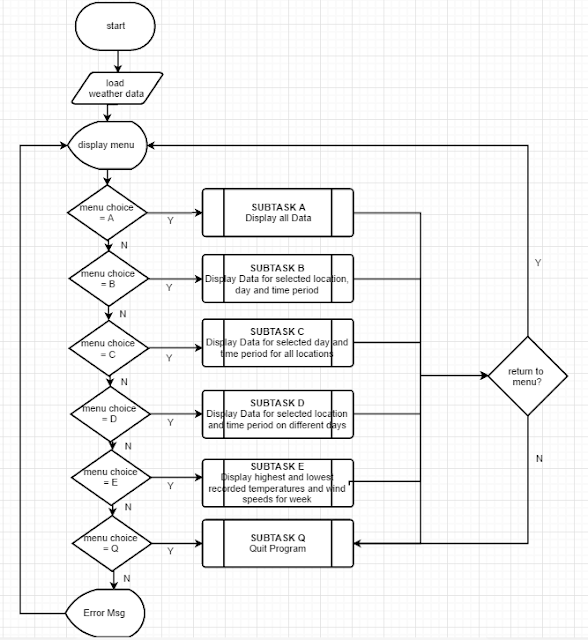
Complete your main program flowchart.
Understand how to complete the IPSO table for each subtask.
Develop an algorithm for each subtask.
Starter:
Homework
Finish your flowchart in draw.io for your main program.

Main:
Task 1
Complete the IPSO table for your main program using the flowchart you created for the main program.
This is located in the 'Design' section of your evidence document.
Task 2
Add to your IPSO table for each subtasks:
A - Display all data
B - Display data for selected date, location and time
C - Display weather data for selected day and time
D - Display weather data for selected location and time
E - Display weekly minimum and maximum temperatures and wind speeds
Q - Quit the program
Task 3
Create a flowchart in draw.io for each subtask.
Hint: Remember you may have subroutines within your subtasks
Plenary:
Update the Tracker with a comment HERE or on classroom.google.com


Comments
Post a Comment